 As more coastal communities face the looming threat of rising sea levels, it’s more important than ever to accurately predict changes in one of the greatest potential sources of sea level rise—the melting of Antarctica’s massive ice sheet.
Recently, scientists analyzed nearly 2 decades’ worth of data from sensitive NASA satellites documenting mass changes in the Antarctic Ice Sheet. They found the ice inventory ebbed and flowed across the continent in unexpectedly variable patterns. Traditionally, some groups of Antarctic researchers have assumed the rate of change across the ice sheet is constant, but they drew their conclusions from data sets that spanned only a few years, said Lei Wang, a geodesist at The Ohio State University who will present this research at AGU’s virtual Fall Meeting 2020.
“These long data records give us the capability to characterize the ice sheet’s variation over a range of timescales,” rather than just modeling seasonal variations and short-term trends, Wang said.
Understanding Long-Term Trends
The Antarctic Ice Sheet, the largest mass of ice on Earth, is divided into two unequal portions, with the East Antarctic Ice Sheet covering about two thirds of the continent. The West Antarctic Ice Sheet, although smaller, has historically been more closely studied because it’s melting faster. (The East Antarctic Ice Sheet sits on bedrock above sea level, said Wang, so it is less susceptible to the effects of the warming ocean.) NASA estimates Antarctica has lost 149 billion metric tons of ice per year since 2002.
When so much ice is involved, projections of how sea levels will respond are uncertain—especially when trends already are so difficult to gauge. Indeed, the field still argues about sea level changes in the past century, said Jim Davis, the study coauthor and a geodesist at the Lamont-Doherty Earth Observatory at Columbia University. “We’ve got to get to the point where we can talk about what’s happening this year in sea level change,” he said.
To do that, researchers need a more sophisticated model of how Antarctica’s shield of ice is evolving.
“We need careful analysis to separate out short-term fluctuations and noise in the data from long-term trends,” said Matt King, a geodesist at the University of Tasmania, Australia, who was not involved in the new research.

The project used data recorded by NASA’s Gravity Recovery and Climate Experiment (GRACE) mission and its successor, the GRACE Follow-On (GRACE-FO), from 2003 through 2020. The GRACE satellites orbited in pairs 500 kilometers above Earth and constantly measured the distance between each other using microwaves. Changes in mass across Earth’s surface alter the gravity field, so when one satellite orbits above a region with higher mass, the stronger gravitational pull tugs it farther away from its partner.
From this information, scientists create detailed gravity maps, which they translate into a dynamic atlas of Earth’s mass distribution. Wang and his colleagues reexamined monthly data from GRACE orbits over Antarctica, applying a new tool to tease out hidden details.
New Approaches for Old Data
Wang developed the technique, called stochastic filtering, as a postdoctoral fellow in Davis’s lab. Data from the GRACE satellites can be noisy, leading to “striping”—systematic errors that create visible vertical stripes on the maps. Stochastic filtering smooths out the stripes while preserving the statistically rigorous uncertainty estimates that are important for modeling.
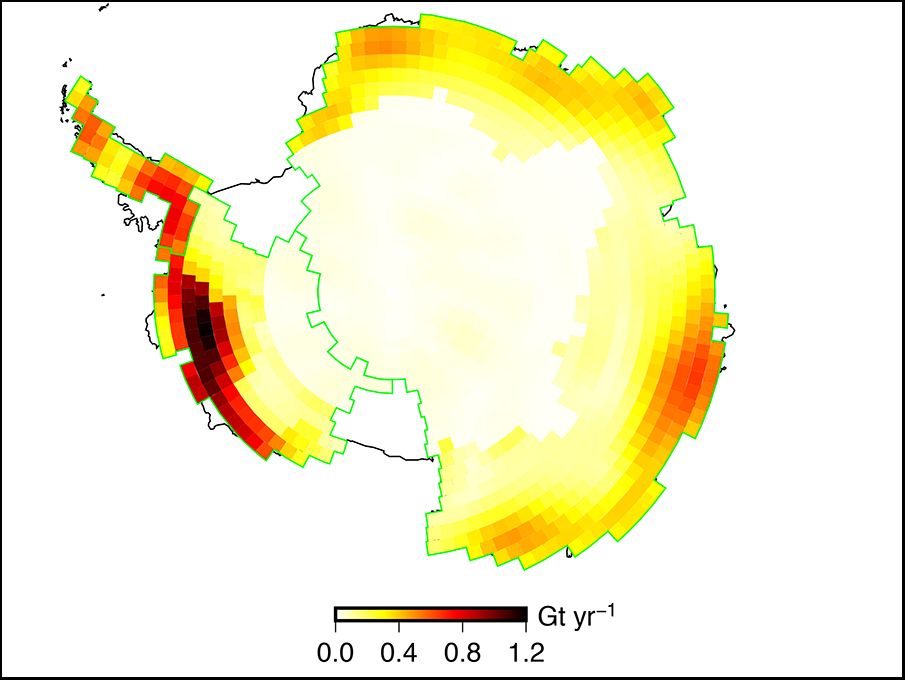
The method exposed a major difference in the continent’s western and eastern blankets of ice. The mass of the West Antarctic Ice Sheet declined steadily, as expected, but the East Antarctic Ice Sheet was sensitive to spikes in the weather. When two extreme snowfall events in 2009 and 2011 dropped around 600 gigatons of snow and ice, the East Antarctic Ice Sheet thickened so much that it temporarily halted the entire continent’s ice losses, said Wang—a pattern that had previously escaped notice.
“New approaches to analyzing old data are really important,” said King. “Because there’s information in there, it’s just a question if we can get it out or not.”
Climate modelers must include such major variations in their accounting, said Davis. “Sea level change due to glacier mass loss is not just these glaciers that are simply slowly melting off. The pace isn’t glacial—it’s dynamic.”
—Stephanie Melchor (@sjmelchor), Science Writer


